Distributed deployment: The Log Collector and the Log Analyzer are deployed separately on two servers.
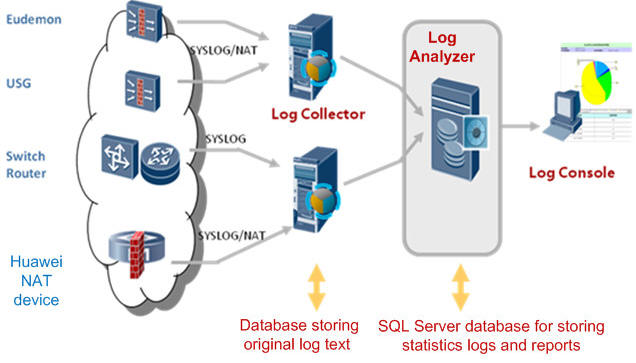
− Log Collector: Receives, aggregates, formats, filters, counts, and stores logs and generates alarms.
− Log Analyzer: Manages policies, reports, devices, systems, and users.
− Log Console: Provides an interaction GUI for managing foreground and background using the web.
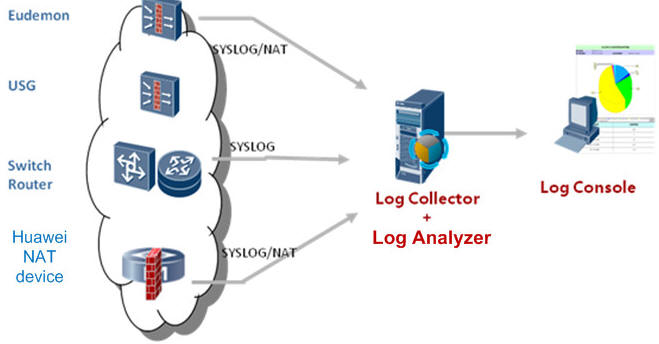
Centralized deployment: When performance requirements are low, LogCenter can also be deployed in a centralized way.
| Performance | |||
|---|---|---|---|
| Maximum Size of Logs Processed per Day | 500 GB | ||
| Maximum Number of Sessions Processed per Day | 4.32 billion | ||
| Maximum Log Recording Speed (standalone mode) | 250,000 EPS | ||
| Maximum Number of NEs Supported by the LogCenter | 2,000 | ||
| Recommended Server Model | LogCenter All-In-One | LogCenter Analyzer | LogCenter Collector |
| Height | 2U | ||
| Dimensions (H x W x D) mm | 86.1 mm (2 U) x 447 mm x 748 mm | ||
| Weight (full configuration) | 30 kg | 27 kg | 30 kg |
| Fixed Ports | 4 x USB, 1 x VGA, 1 x Console, 1 x MGT, and 8 x GE | ||
| Memory | 32 GB | ||
| Storage Space | 2 x 300 GB SAS, 12 x 6-TB SATA | 2 x 300 GB SAS, 6 x 2-TB SATA | 2 x 300 GB SAS, 10 x 6-TB SATA |
| RAID | RAID 1 & RAID 6 | ||
| Redundant Power Modules | Standard | ||
| AC Power Supply | 100V to 240V; 50/60 Hz; 9A to 4.5A | ||
| DC Power Supply | –48V to –60V; 26A | ||
| Maximum Power | 750W AC/800W DC | ||
| Operating Environment |
Operating temperature: 5°C to 45°C (41°F to 113°F) Operating humidity: 8% RH to 90% RH non-condensing |
||
| Non-operating Environment (storage environment) |
Storage temperature: –40°C to +65°C (–40°F to 149°F) Storage humidity: 5% RH to 95% RH non-condensing |
||
| Authentication | CCC, RCM, CE, VCCI, FCC, IC, UL, and BIS | ||
| Function/Feature | |||
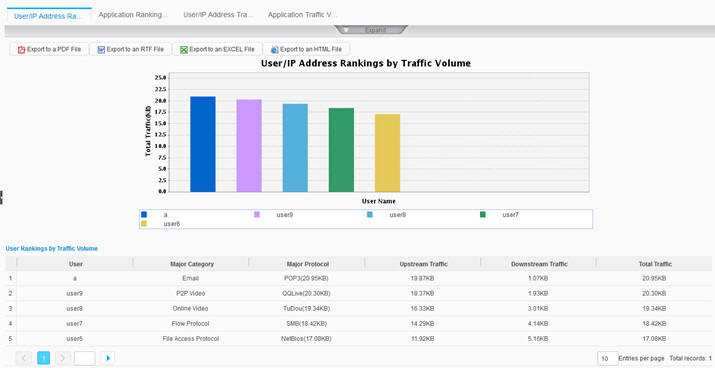
| Dashboard |
Dashboard layout customization, which can be saved for further use Ranking of user IP application behaviors and users by Internet traffic volume, network threat classification and user ranking, attack defense event trend, traffic statistics based on protocol categories, application-layer threat event trend and ranking |
||
| Resource Management |
Log source management, device group management, and discovery of specific IP network segments based on SNMP Real-time collector status management, collector whitelist mode, and interworking between the collector and NEs Log collection modes: syslog, security syslog, jdbc, heartbeat, dataflow, session, RADIUS, netflow, FTP dynamic/static file, and SFTP |
||
| Network Security Analysis |
Access control event log analysis: attack event trend, top 50 attack events/attack sources ActiveX and Applet content filtering log analysis: distribution of filtered packets, top 50 source/destination IP addresses of filtered packets IPS attack behavior analysis: attack event trend by behavior, attack event trend by severity, top 50 attack source IP addresses, attack destination IP addresses, attack protocols, and attacked ports Antivirus log analysis: virus infection trend, top 50 virus events, most infected destination IP addresses, and source IP addresses that send most infected files URL filtering log analysis: top 50 source IP addresses with most web access times as well as most accessed websites and URLs Email filtering log analysis: email connection and matching trend, top 50 IP addresses for email connections that are permitted, blocked, and alerted on ACL rule and forwarding policy matching analysis: ACL rule trend, policy trend, top 50 most-hit interzone security policies IM login and logout audit log analysis: firewall syslog analysis |
||
| Session Analysis |
Million-level IPv4/IPv6 session log query Query of NAT port range, user port pre-allocation, URL session, and IM session logs Display of session trend and top 50 session source/destination IP addresses |
||
| Traffic Analysis |
Real-time traffic trend based on physical ports’ IP application protocols, top 50 users or IP addresses by incoming and outgoing traffic, and region-based traffic ranking report NGFW application traffic ranking and trend; top 50 users or IP addresses by Internet traffic volume |
||
| Online Behavior Analysis |
Top 50 Internet access duration by user/IP address, Internet access trend Top 50 keywords most matched by online behavior (application types include email, web page, and search engine) User URL audit log analysis: top 50 websites by visit count or volume of uploaded content Email filtering log analysis and application service type analysis: top 50 application service types Top 50 users whose online behaviors match most threats, including virus and intrusion threats Analysis of file sending logs: top 50 email, FTP, and HTTP-based file sending logs |
||
| SSL VPN Analysis | Analysis and top 50 SSL VPN users by traffic volume, users by virtual gateway traffic volume, connections, online users, intranet resource access, and mobile terminal access types | ||
| Log Audit |
Top 50 log types with specific NE types, NEs, or time ranges Setting of log audit rules for NEs, so that audit events are generated for logs matching the log audit rules |
||
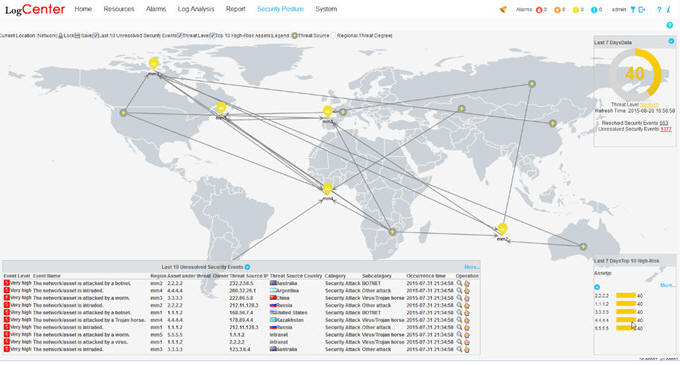
| Security Posture Awareness |
Real-time display of enterprise and regional security posture, top 10 high-risk assets, 10 latest security events, and threat severities Security trend of specific regions, including the threat map, threat severity trend, and trends of various events Interworking with the Agile Controller for the execution of security policies; configuration of SMS and email notification for security events Management and configuration of asset groups |
||


